
RSI Is Not Overbought or Oversold
RSI is commonly described as an overbought or oversold indicator, yet this framing leads many traders to fade strong trends and fight momentum. This article explains what RSI actually measures and how professionals interpret it within market context.
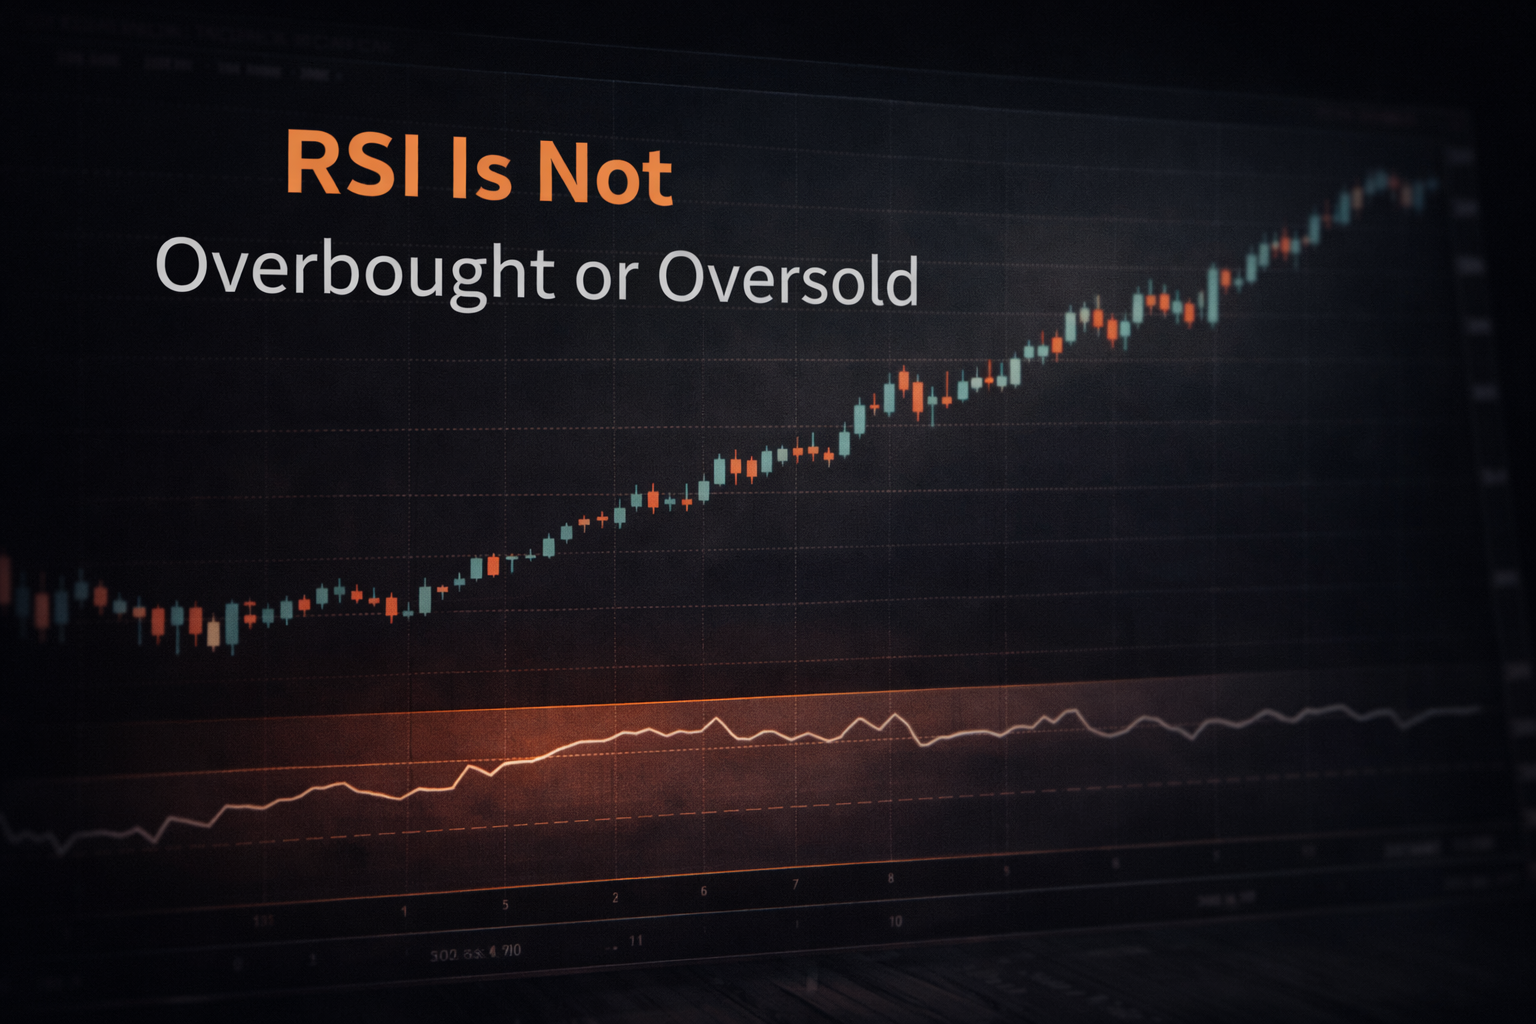
Relative Strength Index, or RSI, is one of the most widely used indicators in trading, and it is also one of the most commonly misunderstood. Many traders are taught that high RSI readings signal overbought conditions and low readings signal oversold conditions, leading them to expect reversals whenever RSI reaches an extreme.
This interpretation creates consistent problems because it treats RSI as a timing tool rather than a momentum measure. RSI does not identify when price must reverse. It describes the strength and persistence of recent price movement. When this distinction is missed, traders end up fading strong trends and entering positions against momentum.
RSI measures the speed and magnitude of recent price changes. Strong trends naturally produce sustained momentum, which causes RSI to remain elevated or depressed for extended periods. These conditions are not warnings of imminent reversal. They are evidence of strength.
Professional traders do not interpret high RSI readings as automatic sell signals. In trending markets, elevated RSI often confirms continuation rather than exhaustion. The same logic applies to low RSI readings in strong downtrends, where persistent weakness reflects sustained selling pressure rather than an opportunity to buy.
A useful mental model is to think of RSI as a condition indicator rather than a trigger. It answers the question of how strong recent movement has been, not whether price should change direction. When traders use RSI as a trigger without context, they substitute interpretation with assumption.
The consequences of this misunderstanding are predictable. Traders fade trends too early, experience repeated small losses, and lose confidence in an indicator that is behaving exactly as designed. Over time, RSI is labeled unreliable when the real issue is misapplication.
Context determines how RSI should be read. In range-bound markets, RSI extremes can be meaningful because momentum tends to mean revert. In trending environments, RSI extremes often persist because momentum feeds continuation. Without identifying the broader market regime, RSI readings are easily misinterpreted.
Professional traders often use RSI to assess momentum alignment rather than reversal timing. When RSI remains strong during pullbacks, it suggests trend health. When RSI fails to confirm new price extremes, it may indicate weakening momentum, but not necessarily immediate reversal.
RSI also becomes more informative when compared across timeframes. A lower-timeframe RSI may cycle quickly while higher-timeframe RSI remains elevated, signaling that short-term fluctuations are occurring within a stronger trend structure. This perspective prevents overreaction to temporary momentum shifts.
ChartDetector.ai interprets RSI within broader market context rather than treating threshold levels as standalone signals. RSI readings are evaluated alongside structure, volatility, and trend conditions to determine whether momentum supports or contradicts the prevailing environment.
RSI is not overbought or oversold in isolation. It reflects strength or weakness relative to recent price behavior. The next time RSI reaches an extreme, the more important question is not whether it is too high or too low, but what that strength or weakness says about the market environment.
Related Articles

Why Markets Punish Consensus
When everyone agrees on where the market is going, the opportunity is often already diminishing. This article explains why consensus creates comfort but rarely creates edge, and why professional traders pay close attention to crowd positioning.
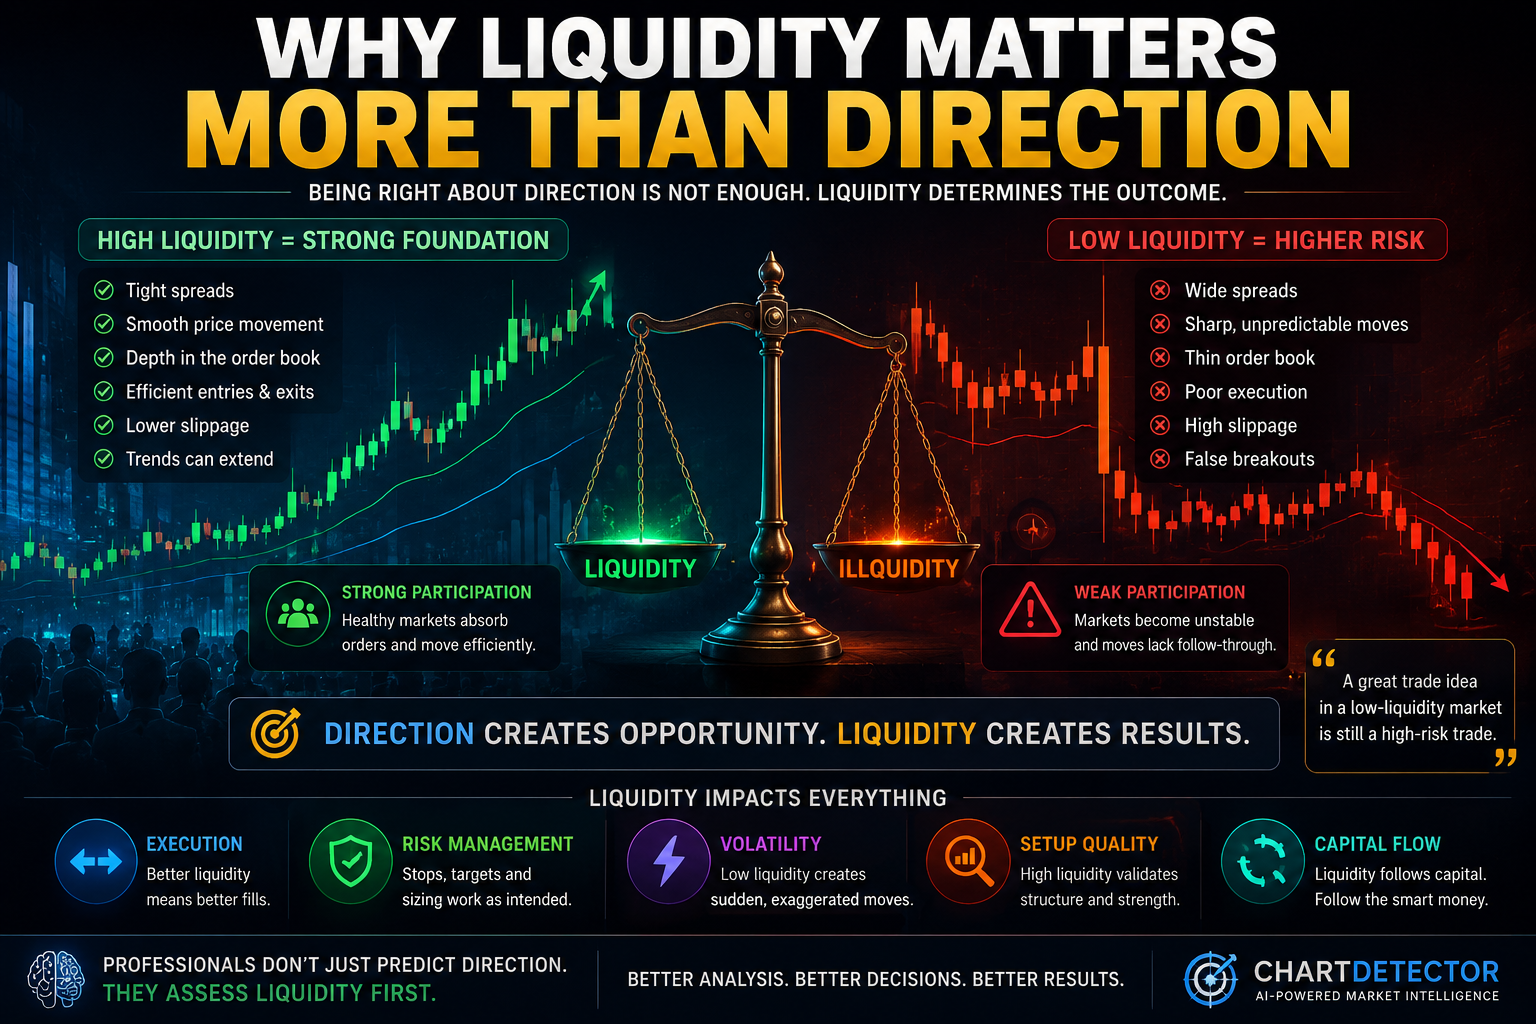
Why Liquidity Matters More Than Direction
Most traders focus on whether a market will move higher or lower. Professional traders focus on liquidity. This article explains why liquidity drives price movement, how it influences risk, and why being right about direction is often not enough.
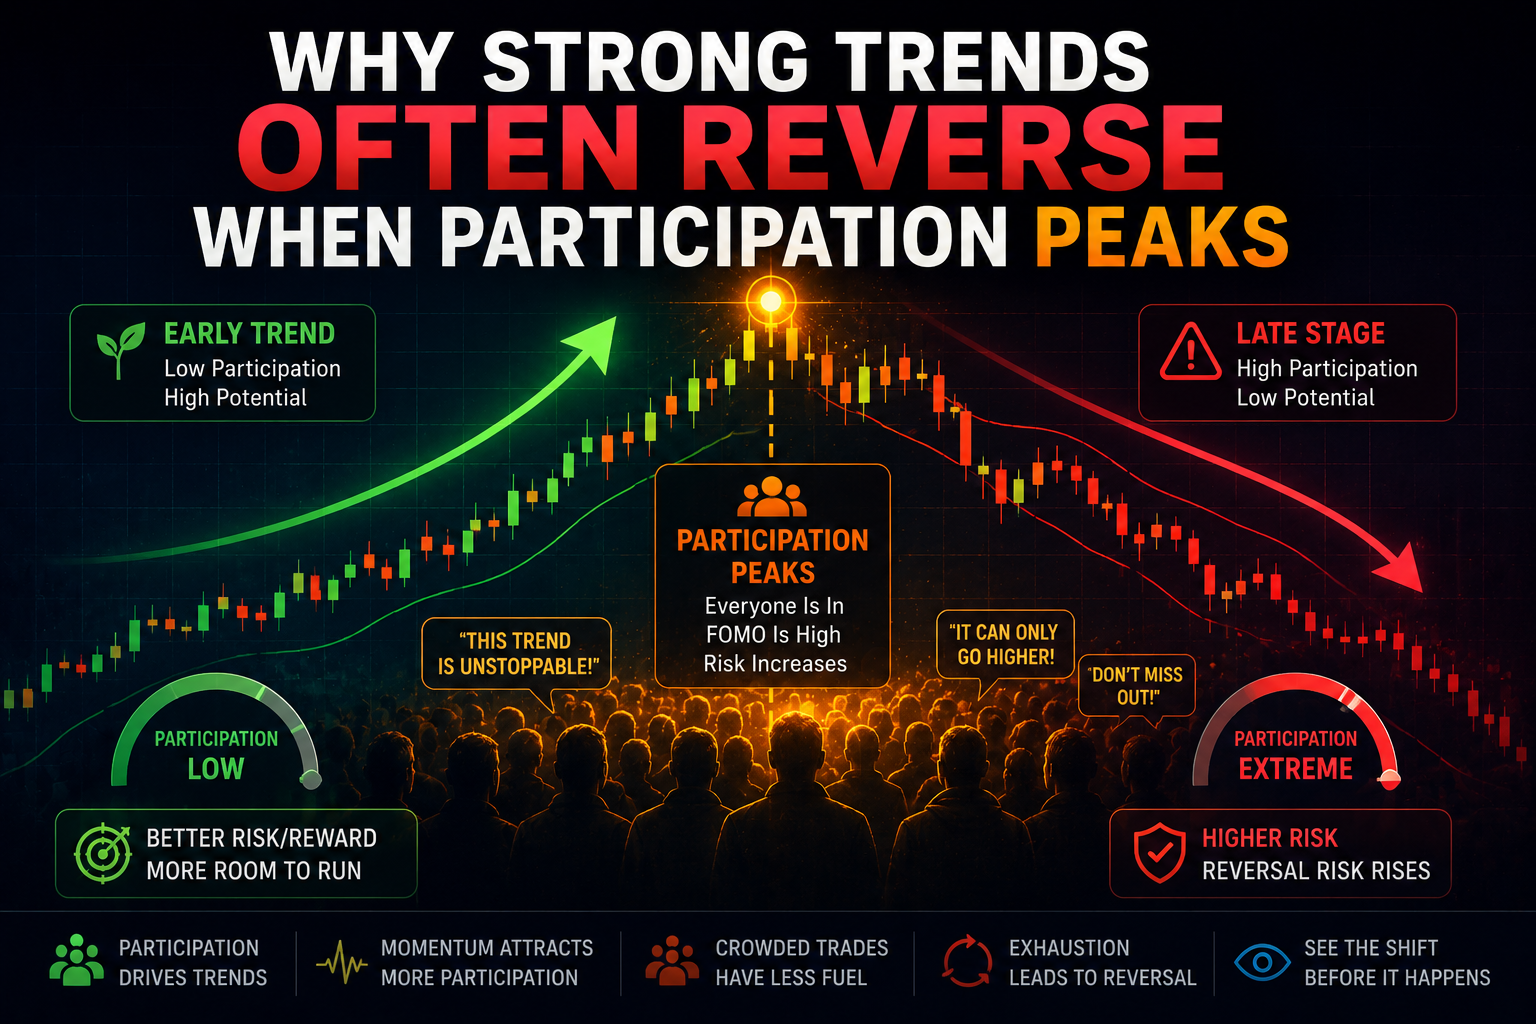
Why Strong Trends Often Reverse When Participation Peaks
Strong trends often appear safest near their peak, yet this is frequently where reversal risk begins increasing. This article explains how participation saturation develops and why late-stage momentum can weaken market structure.