
How Capital Rotation Drives Markets
Markets do not move uniformly. They rotate as capital shifts between sectors and asset classes. This article explains how capital rotation forms trends before they become obvious and why most traders miss it.
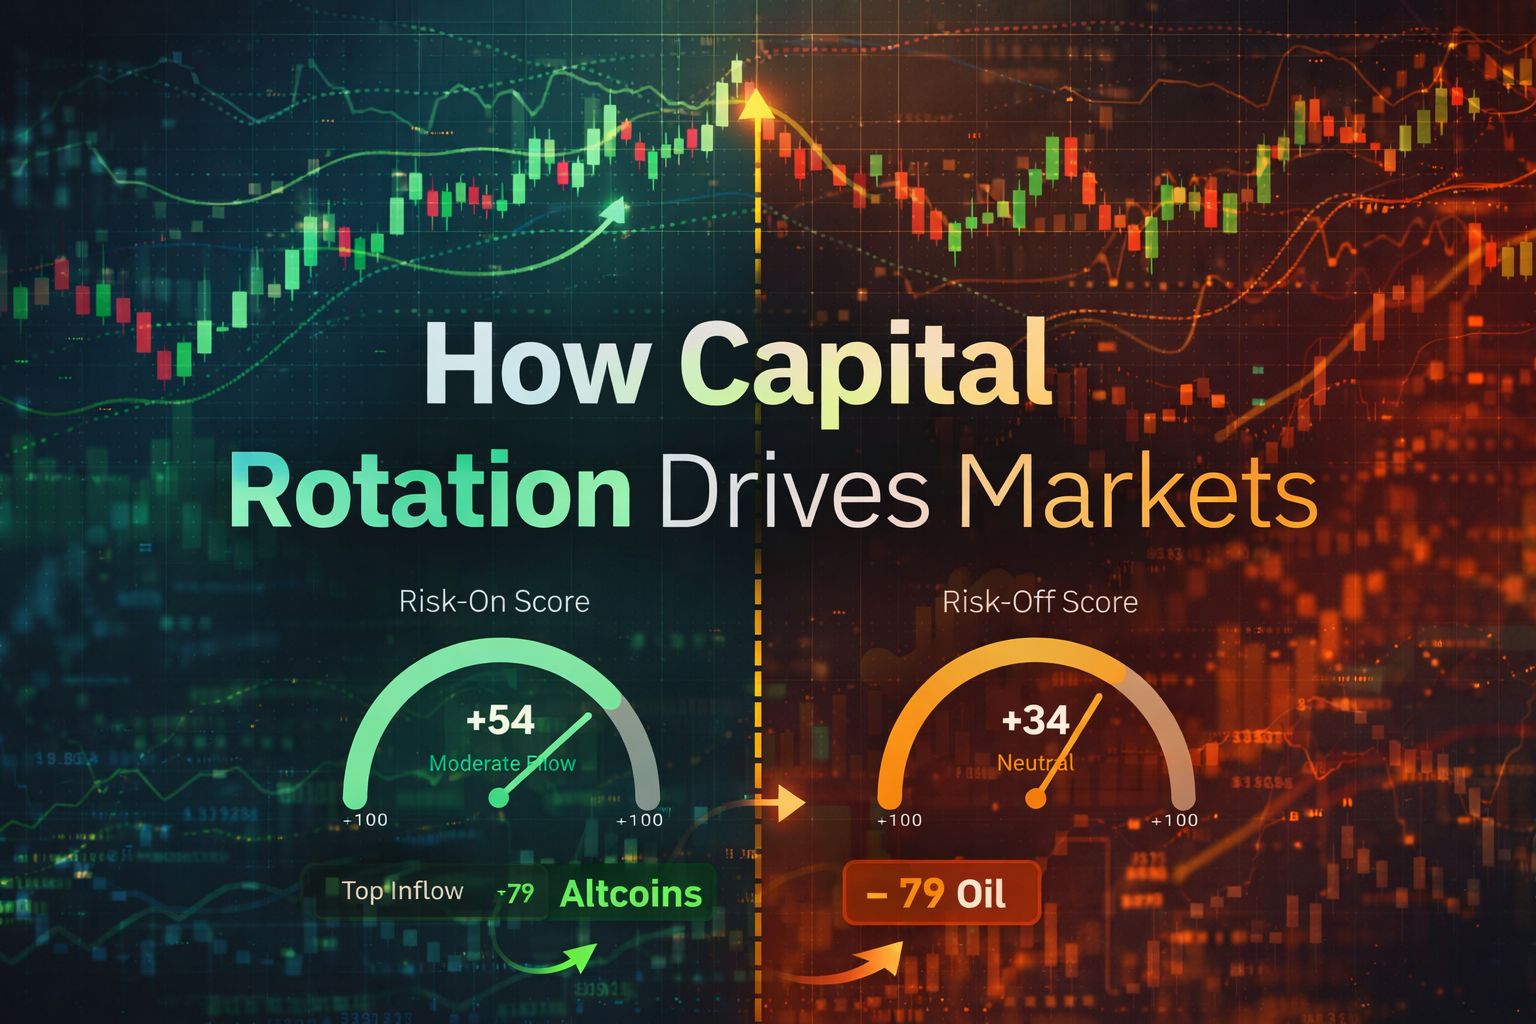
Markets do not move all at once. They rotate as capital shifts from one area to another. While many traders focus on individual charts, broader market movement is often driven by changes in allocation rather than isolated price action. By the time a move becomes visible on a single asset, the underlying rotation has usually already begun.
A common misconception is that price leads market behavior. In practice, price is more often the result of positioning changes rather than the cause. Before trends become obvious, institutions adjust exposure, funds rebalance portfolios, and capital begins concentrating in specific areas. Price reflects this process after it is already underway.
Capital rotation is not a single event. It develops gradually as allocation shifts in response to changing conditions. These shifts are influenced by factors such as macroeconomic expectations, interest rate environments, sector performance, and broader risk appetite. As capital moves, leadership within the market changes, even if this is not immediately visible through individual charts.
This process explains why trends often appear to develop without a clear starting point. By the time price action confirms a move, participation has already increased and positioning has already adjusted. Traders who rely solely on breakout signals or pattern recognition frequently encounter moves after the most favorable conditions have passed.
One of the primary reasons traders miss capital rotation is the tendency to analyze markets in isolation. Focusing on a single asset removes the context necessary to understand how capital is flowing across the broader system. Rotation rarely presents itself clearly within one chart. Instead, it appears through relative strength differences, changes in participation, and emerging activity across groups of related assets.
Early signs of rotation often appear in aggregated instruments such as sector indices or exchange-traded funds. These instruments reflect collective capital flow and can begin trending before individual components fully respond. This creates a situation where broader movement is developing while underlying assets still appear neutral or inconsistent.
Rotation also becomes visible through cross-asset relationships. The interaction between equities, bonds, commodities, currencies, and digital assets reflects how capital is being allocated globally. Changes in these relationships often indicate shifts in risk appetite or macro positioning before they become apparent within a single market.
It is important to distinguish between rotation and momentum. Momentum is visible through strong price movement, increasing volume, and clear directional trends. Rotation occurs earlier, when subtle changes in relative strength and participation begin to form. Momentum attracts attention, while rotation creates the conditions that allow momentum to develop.
As rotation progresses, it eventually becomes visible to a wider group of participants. At this stage, price trends become clearer, narratives begin to form, and participation expands rapidly. While this phase appears attractive, it often represents a later stage of the move where risk has increased and the available edge has decreased.
Understanding capital rotation shifts the focus from reacting to price toward interpreting flow. Instead of asking which asset is moving, traders begin to evaluate where capital is concentrating and whether that concentration is strengthening or weakening. This perspective provides earlier insight into developing trends.
In practice, identifying these shifts consistently can be difficult because they require monitoring multiple assets, sectors, and relationships simultaneously. This is where tools designed to track relative strength and cross-asset behavior become valuable. For example, ChartDetector’s Capital Rotation Plus feature aggregates market activity across tracked assets and highlights where capital concentration is increasing or fading. Rather than relying on a single chart, it allows traders to observe how leadership is changing across the broader market.
Modern markets are increasingly interconnected, and capital moves across asset classes more dynamically than in the past. As a result, rotation occurs more frequently and trends can form more quickly. This reduces the effectiveness of isolated analysis and increases the importance of understanding how markets interact as a system.
ChartDetector evaluates market conditions within this broader context by analyzing relationships across assets, changes in participation, and emerging shifts in momentum. This approach helps identify where capital may be rotating before movements become widely recognized.
Markets are not simply collections of individual assets. They are systems of capital allocation. When capital moves, leadership changes and trends emerge. Recognizing these shifts requires looking beyond individual charts and understanding how the broader system is evolving.
The most important question is not which asset is moving, but why capital is moving there. That question often provides insight before price makes the answer obvious.
Related Articles

Why Markets Punish Consensus
When everyone agrees on where the market is going, the opportunity is often already diminishing. This article explains why consensus creates comfort but rarely creates edge, and why professional traders pay close attention to crowd positioning.
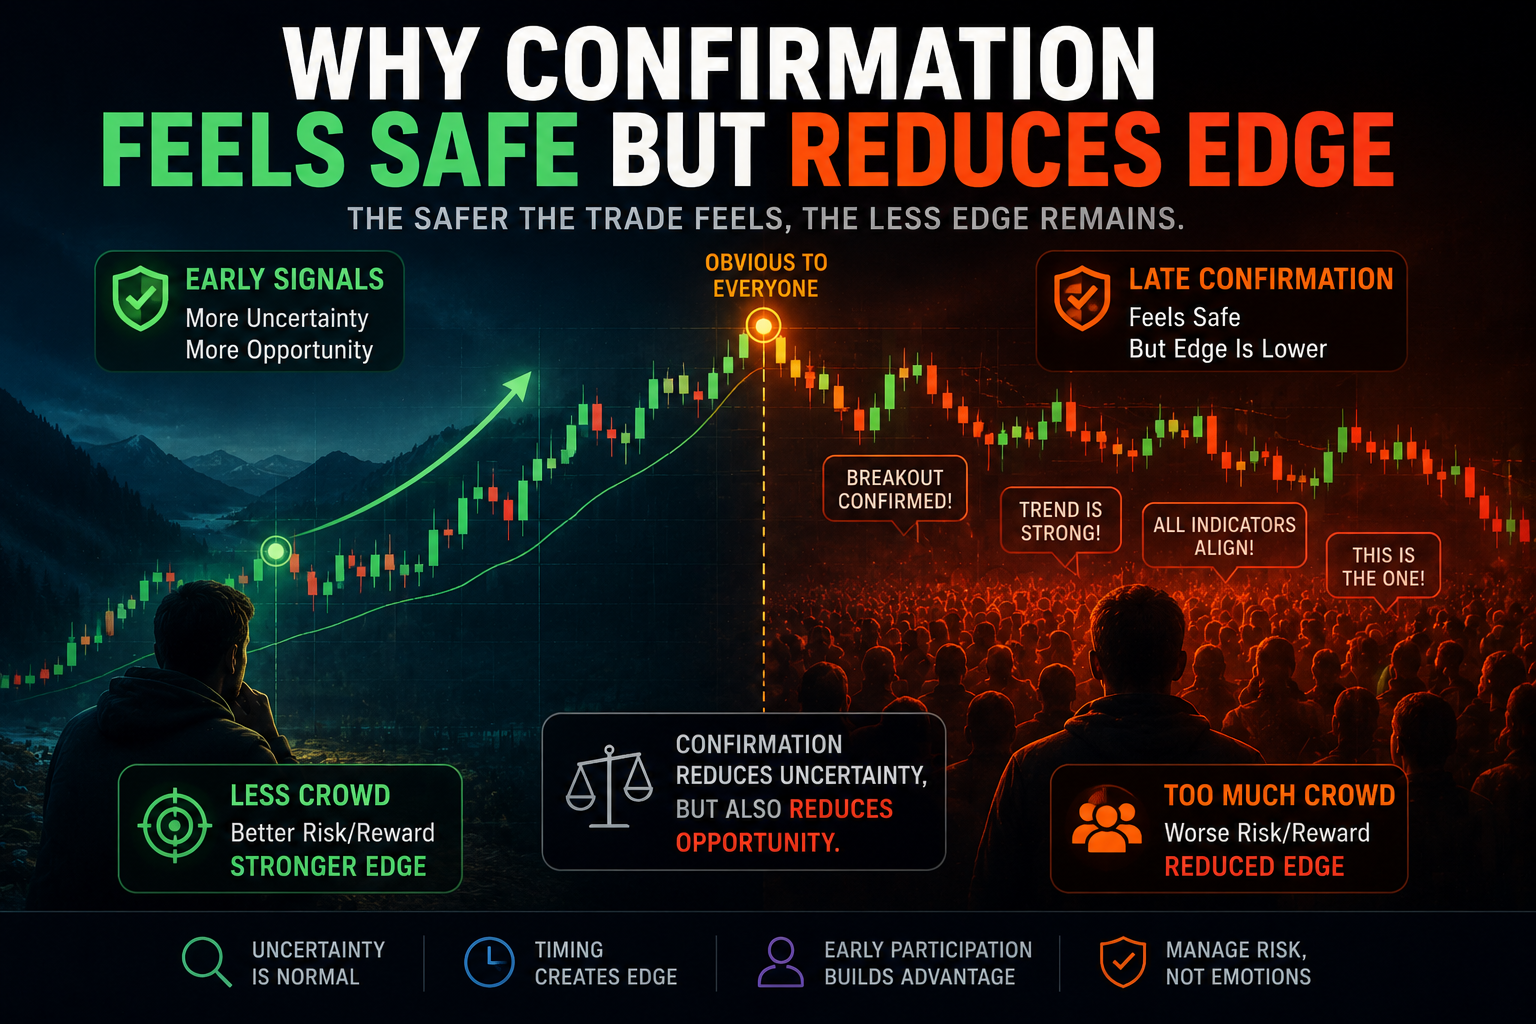
Why Confirmation Feels Safe But Reduces Edge
Confirmation reduces uncertainty, but it often reduces opportunity as well. This article explains why traders naturally seek confirmation, how it leads to crowded positioning, and why professional traders balance validation with timing.
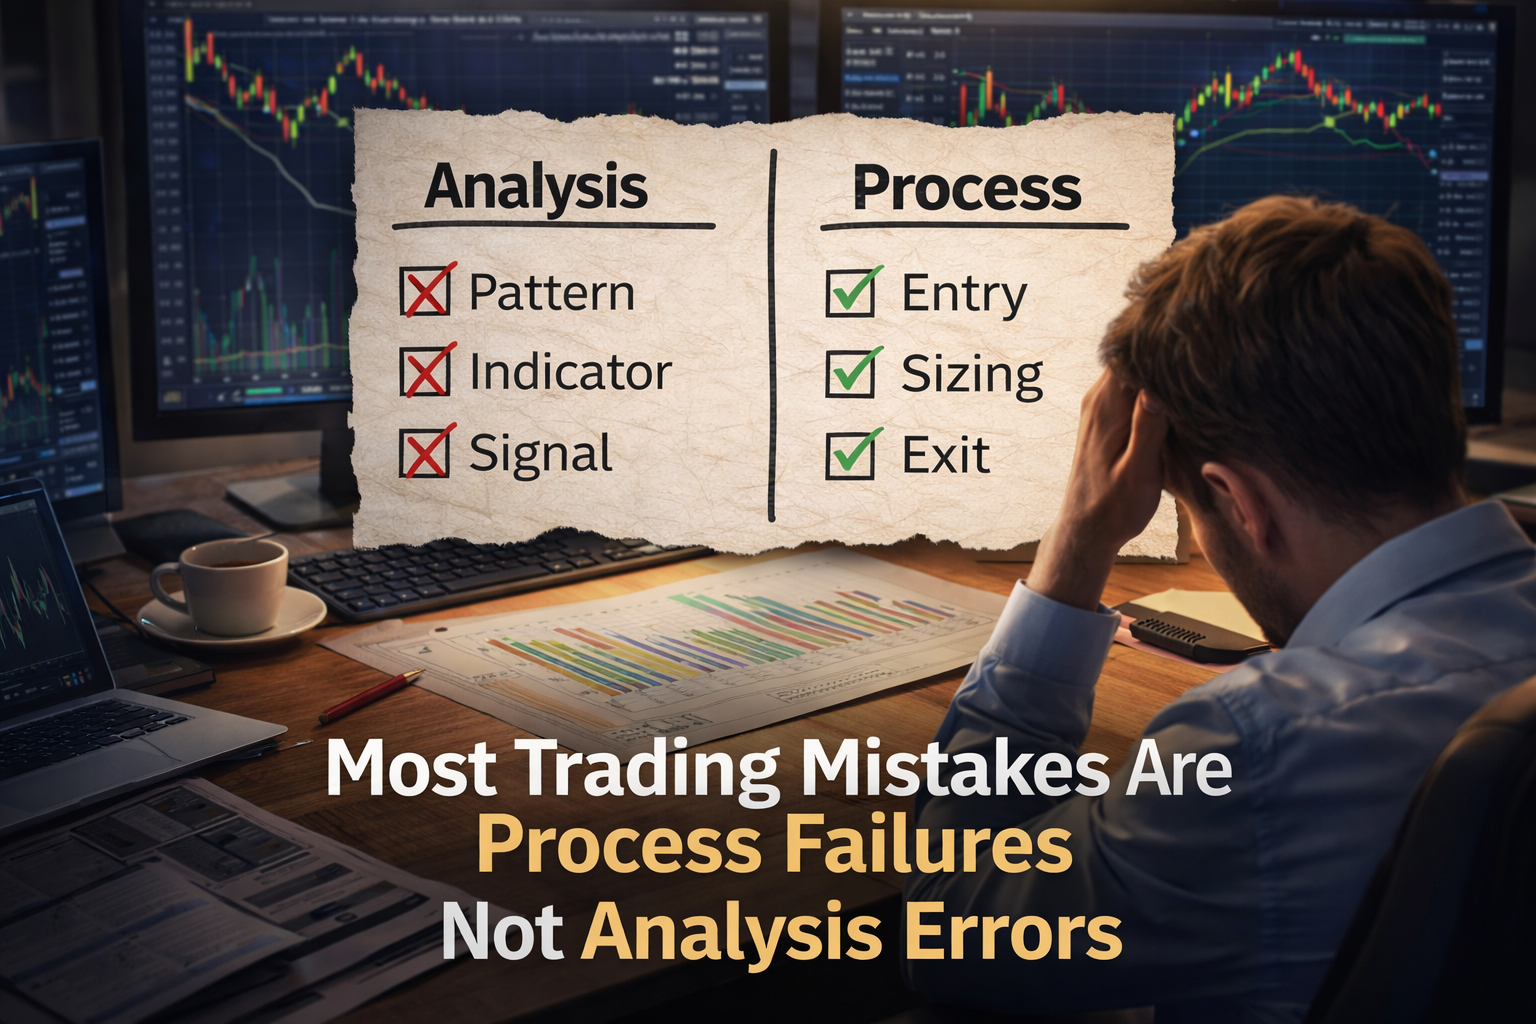
Why Most Trading Mistakes Are Process Failures Not Analysis Errors
Traders often blame losses on bad analysis, yet most mistakes come from poor execution of a sound process. This article explains why process breakdowns matter more than analysis errors and how professionals build consistency through structure.