Multiple Timeframe Indicators Do Not Mean Multiple Confirmations
Many traders believe that aligning indicators across multiple timeframes increases confirmation. In reality, it often creates redundancy rather than independent validation. This article explains why multi-timeframe stacking can produce false confidence and how professionals interpret timeframe alignment correctly.
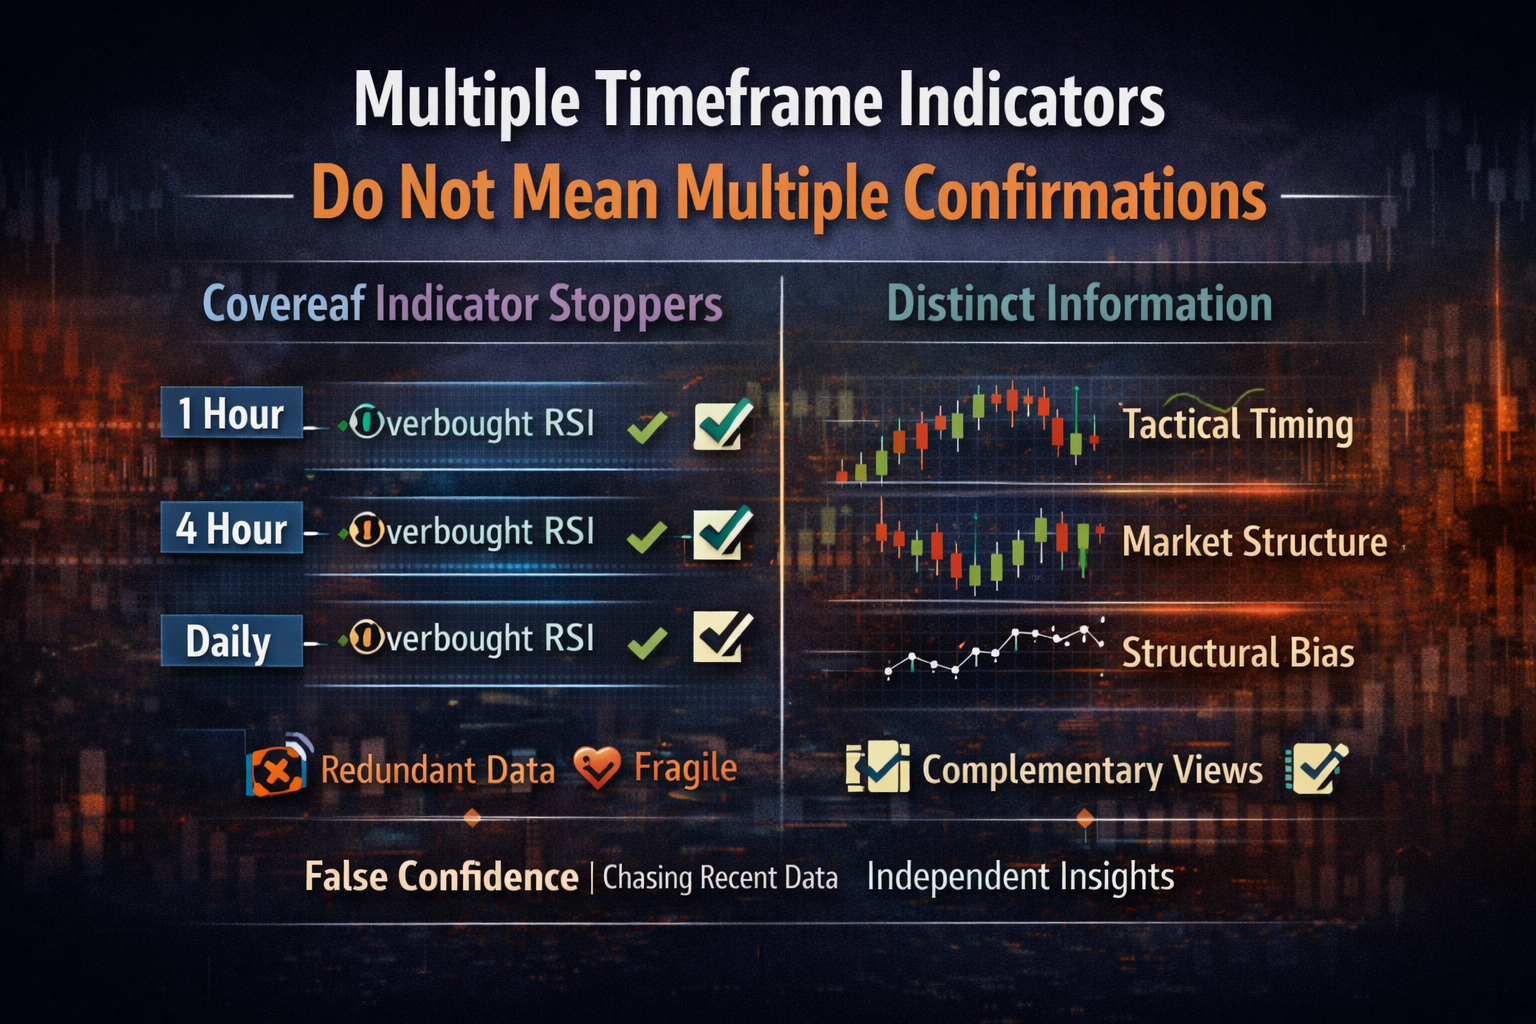
The idea of multiple confirmations across timeframes sounds logical. If an indicator signals strength on the one-hour chart and also signals strength on the four-hour chart, many traders assume the probability of success has increased. The reasoning feels intuitive. More agreement should mean more certainty.
In practice, this assumption often confuses redundancy with confirmation.
Indicators across timeframes are not independent variables. They are derived from the same underlying price data, only aggregated differently. When a higher timeframe indicator aligns with a lower timeframe indicator, it frequently reflects the same directional movement expressed at different levels of compression.
This is correlation, not confirmation.
True confirmation requires independent information. When two tools measure the same phenomenon using the same source data, alignment does not materially increase edge. It increases confidence, which is not the same thing.
Professional traders understand that timeframe alignment is contextual rather than additive. A higher timeframe trend may provide directional bias, while a lower timeframe structure provides timing. These roles are complementary, but they are not separate confirmations of probability.
Stacking the same indicator across multiple timeframes often creates a false sense of statistical reinforcement. For example, an overbought reading on a daily RSI and an overbought reading on a four-hour RSI do not represent two independent warnings. They reflect the same sustained upward pressure viewed through different lenses.
This distinction matters because false confirmation leads to oversized risk and reduced skepticism. When traders believe they have multiple layers of validation, they tend to lower their analytical standards and widen their exposure.
A more robust approach is to assign each timeframe a specific function. Higher timeframes define structural direction and regime. Intermediate timeframes clarify participation and momentum. Lower timeframes refine execution and risk placement. When each layer serves a different purpose, alignment becomes meaningful.
Conflict between timeframes is not necessarily a contradiction. It may indicate transition. A lower timeframe reversal against a higher timeframe trend can signal pullback, distribution, or early structural change. Dismissing such signals because they lack full alignment oversimplifies market behavior.
Professional trading is not about stacking agreement. It is about understanding interaction.
ChartDetector evaluates signals within this hierarchical framework. Rather than treating multi-timeframe alignment as automatic confirmation, the platform distinguishes between structural bias, tactical timing, and risk validation. This separation reduces redundancy and improves clarity.
The goal is not to eliminate multi-timeframe analysis. It is to use it intentionally.
When reviewing charts across different timeframes, the critical question is not whether they agree. It is whether each timeframe is contributing distinct information to the decision process.
Agreement without independence increases comfort.
Independence increases edge.
Understanding the difference prevents confidence from replacing analysis.
Related Articles

Why Markets Punish Consensus
When everyone agrees on where the market is going, the opportunity is often already diminishing. This article explains why consensus creates comfort but rarely creates edge, and why professional traders pay close attention to crowd positioning.
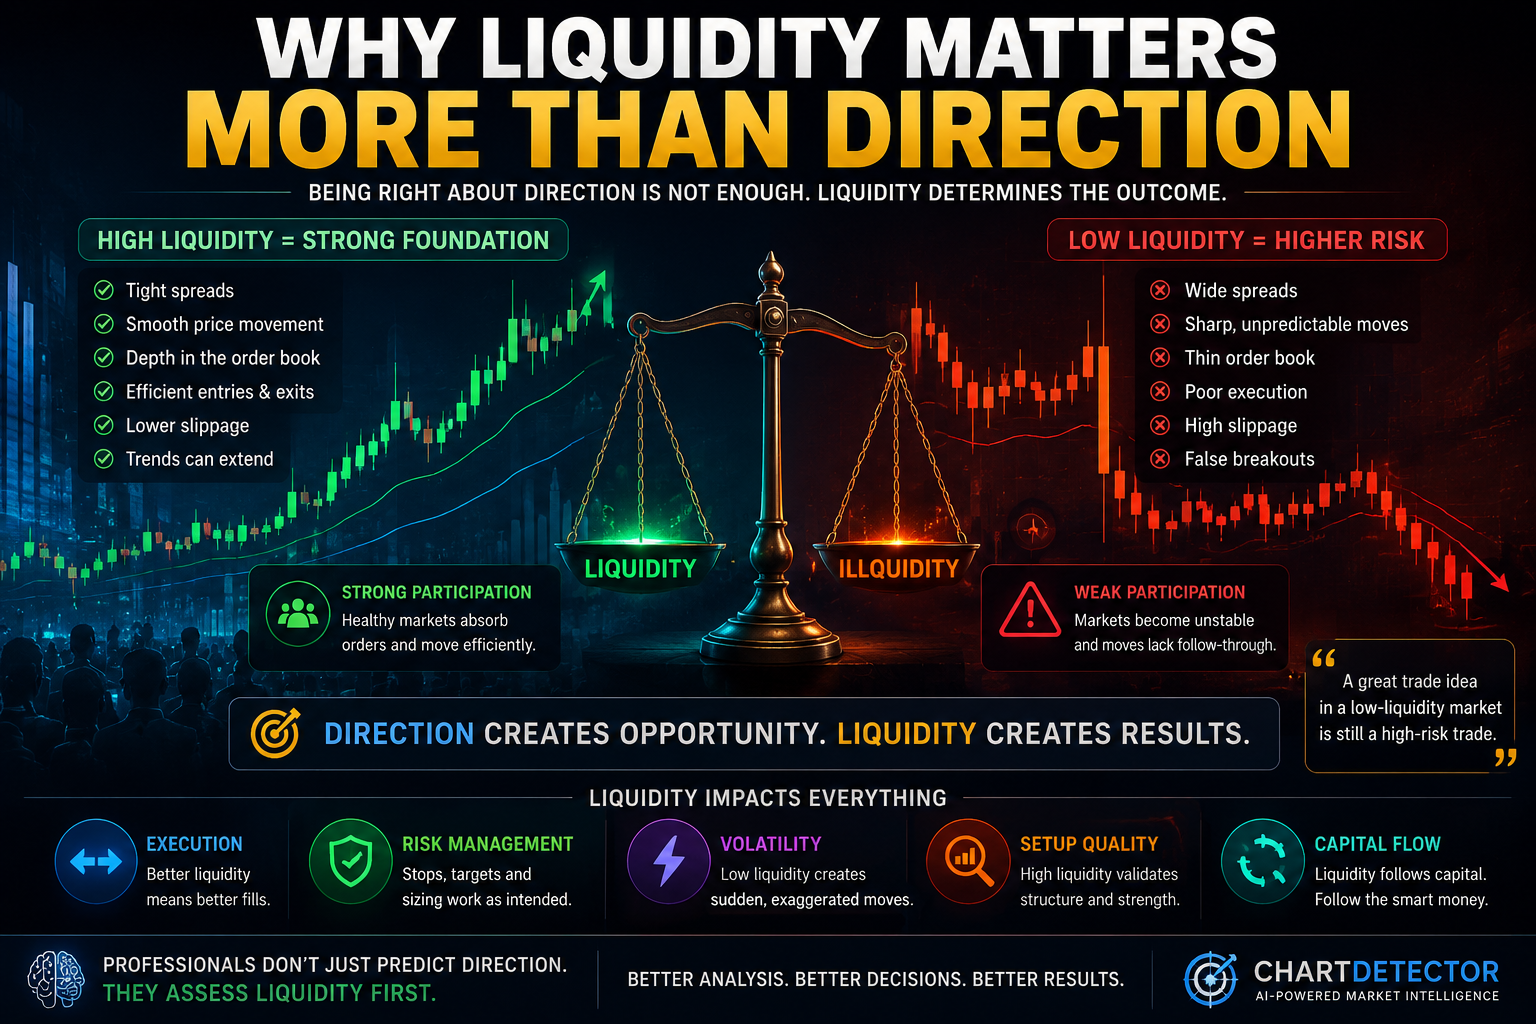
Why Liquidity Matters More Than Direction
Most traders focus on whether a market will move higher or lower. Professional traders focus on liquidity. This article explains why liquidity drives price movement, how it influences risk, and why being right about direction is often not enough.
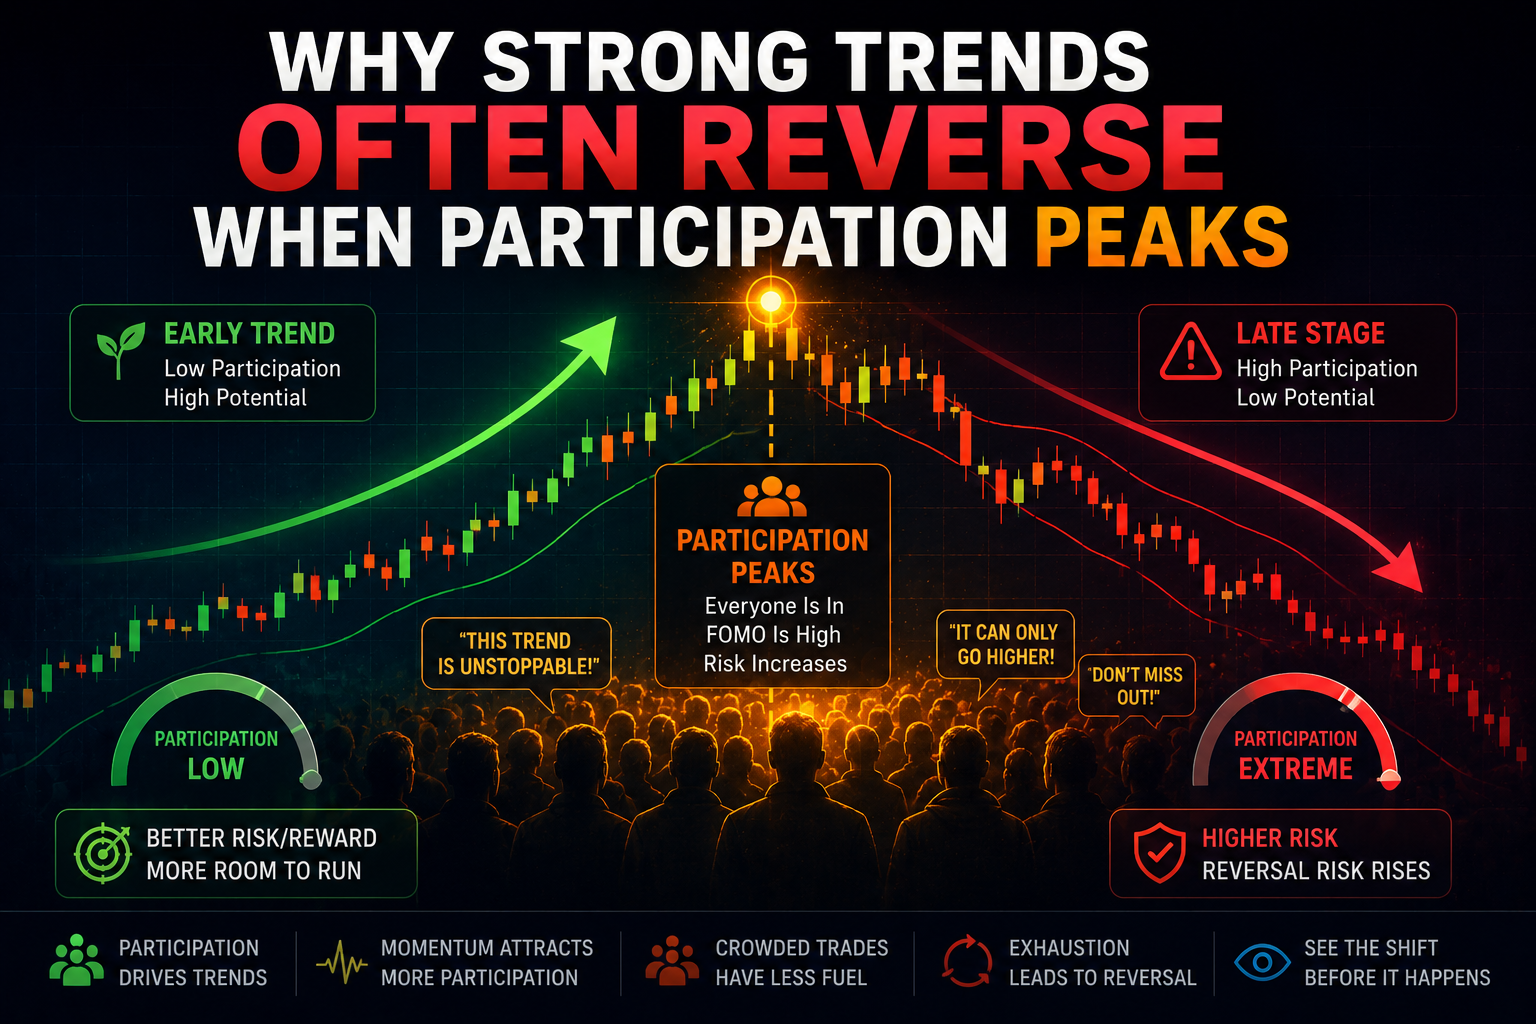
Why Strong Trends Often Reverse When Participation Peaks
Strong trends often appear safest near their peak, yet this is frequently where reversal risk begins increasing. This article explains how participation saturation develops and why late-stage momentum can weaken market structure.