
Support and Resistance Is a Zone, Not a Line
Support and resistance are often drawn as precise levels, but markets rarely react with precision. This article explains why professional traders treat support and resistance as zones and how this approach improves structure analysis, risk placement, and emotional control.
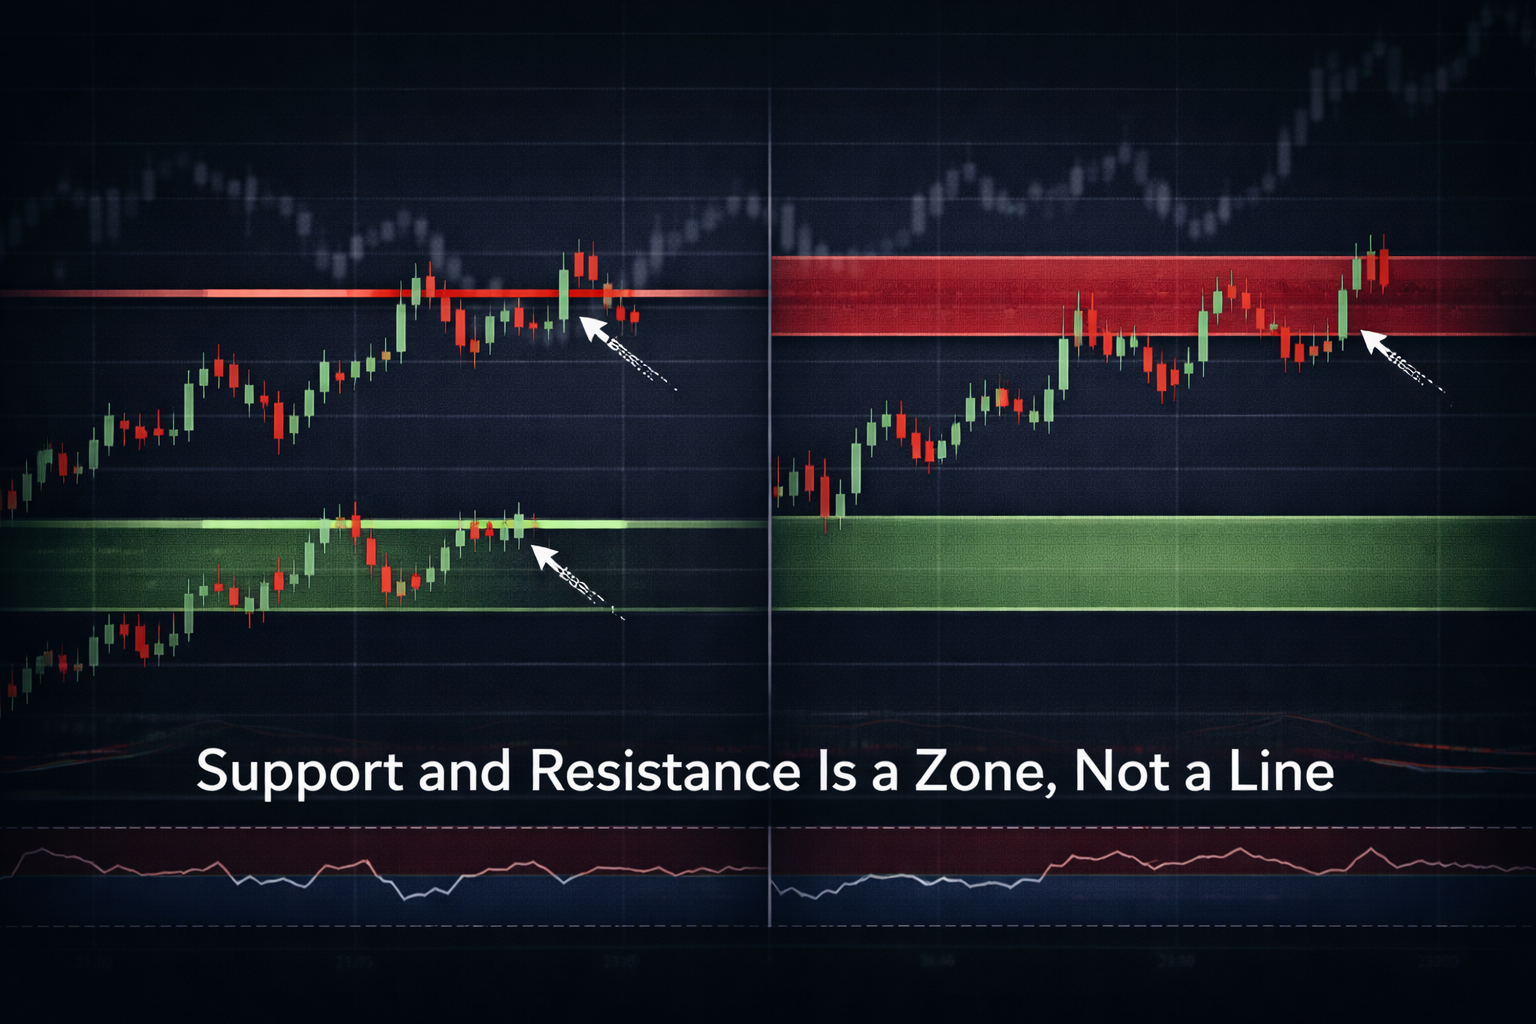
Support and resistance are among the first concepts traders encounter, yet they are also among the most frequently misunderstood. Many traders are taught to draw precise horizontal lines and expect price to react exactly at those levels, which creates false expectations about how markets behave.
Markets do not operate with mathematical precision. Price movement reflects the interaction of liquidity, participation, and decision-making across thousands of market participants with different objectives and time horizons. Expecting all of that activity to resolve at a single price point ignores the probabilistic nature of markets.
Professional traders make a critical distinction that most newer traders miss: lines imply certainty, while zones reflect participation. Support and resistance represent areas where buying or selling interest has previously emerged, not exact prices where the market is obligated to react again.
When traders rely on thin lines, normal price behavior is often misinterpreted as failure. A brief move below support or above resistance feels like a breakdown or breakout, even when price remains within a broader area of acceptance. This misinterpretation leads to premature entries, emotional exits, and misplaced confidence.
The real-world consequences of this misunderstanding are significant. Stops are frequently placed too close to structure, trades are entered before confirmation develops, and normal volatility is experienced as threat rather than information. Over time, this erodes trust in structure and increases reactive decision-making.
Zones account for how price actually behaves over time, with wicks probing liquidity, candle bodies settling within areas of value, and reactions developing across multiple candles rather than at a single price. By treating support and resistance as areas instead of points, traders allow price to express intent without forcing interpretation.
This perspective immediately improves decision quality. Instead of asking whether a level has been touched or broken, traders observe how price behaves within a zone. Acceptance suggests balance and continuation risk, while rejection suggests potential reversal or directional continuation depending on broader context.
Zones also become increasingly important when analyzing multiple timeframes. A level that appears precise on a lower timeframe often exists within a much wider zone on a higher timeframe. Professional traders anchor structure to higher-timeframe zones and refine execution only after alignment is clear.
ChartDetector evaluates market structure using this same principle by treating support and resistance as dynamic zones informed by repeated interaction, volatility behavior, and contextual alignment. This approach helps traders avoid false breakouts and risk decisions driven by over-precision.
Support and resistance are not about drawing perfect levels. They are about understanding where the market has previously made decisions and how price behaves when it returns to those areas. The next time price approaches a key level, the more important question is not whether a line has been crossed, but whether the market is accepting or rejecting the area.
Related Articles

Why Markets Punish Consensus
When everyone agrees on where the market is going, the opportunity is often already diminishing. This article explains why consensus creates comfort but rarely creates edge, and why professional traders pay close attention to crowd positioning.
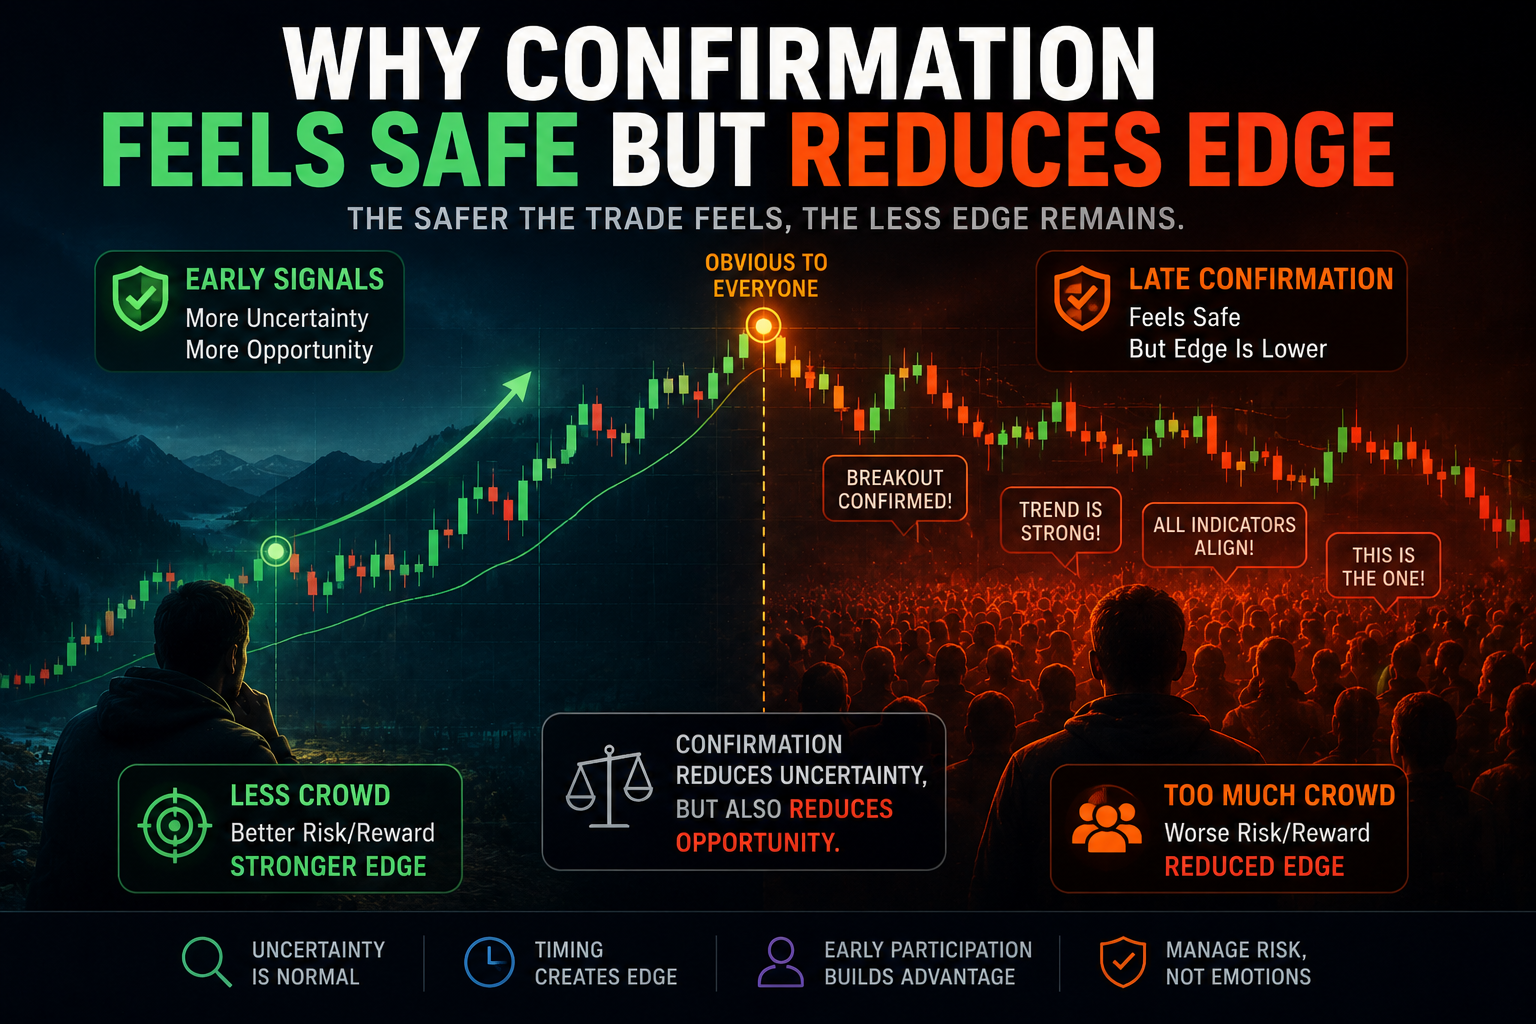
Why Confirmation Feels Safe But Reduces Edge
Confirmation reduces uncertainty, but it often reduces opportunity as well. This article explains why traders naturally seek confirmation, how it leads to crowded positioning, and why professional traders balance validation with timing.
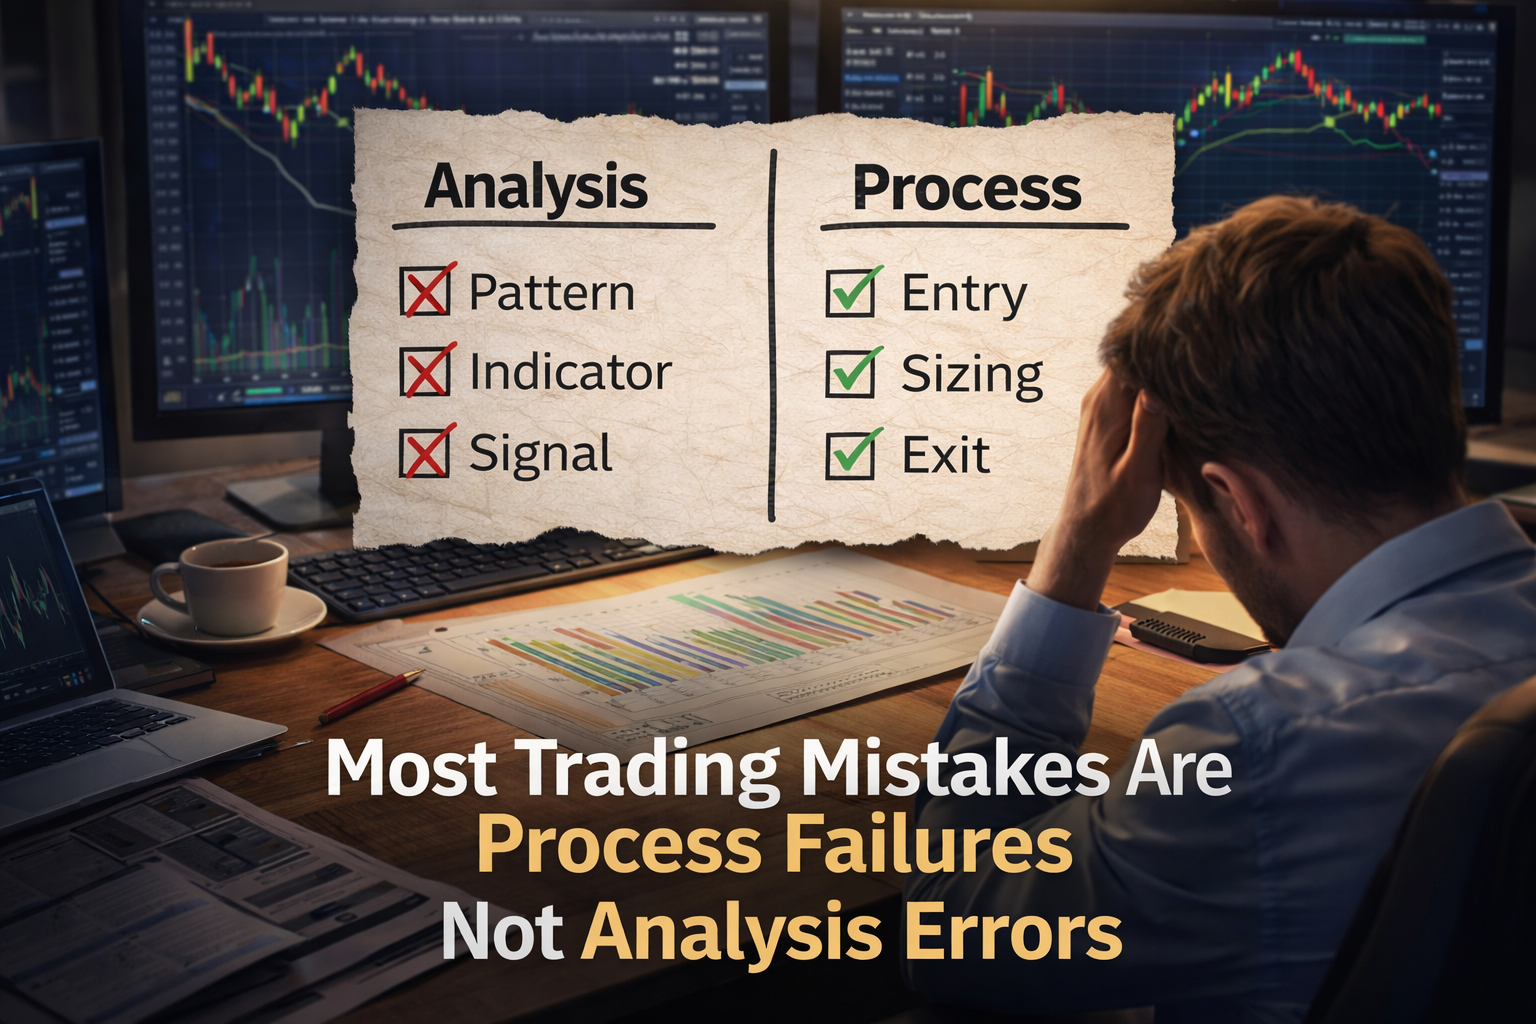
Why Most Trading Mistakes Are Process Failures Not Analysis Errors
Traders often blame losses on bad analysis, yet most mistakes come from poor execution of a sound process. This article explains why process breakdowns matter more than analysis errors and how professionals build consistency through structure.